| Subscription Plan | Free Demo | Australia | Europe | North America | Full Access – All countries |
|---|---|---|---|---|---|
| Price (EUR per Year – 1 user) | 0 | 290 | 490 | 490 | 1 190 |
| Sign Up Free | Select | Select | Select | Select | |
| Feautures: | |||||
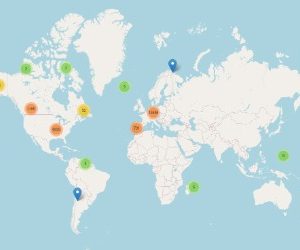
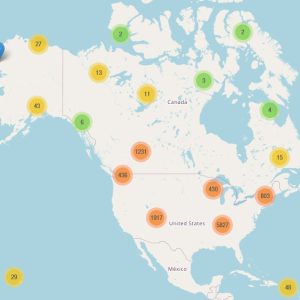
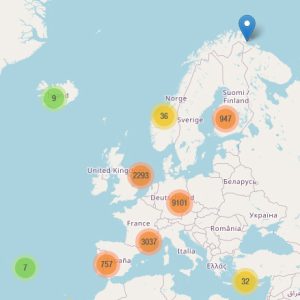
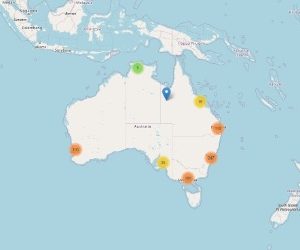
| Geographical scope | Austria | Australia | 27 EU countries + UK + Switzerland + Norway + Iceland and Liechtenstein | USA + Canada | Europe + North America + Australia |
| Maps | |||||
| Chart Download | |||||
| Facilities Included | 260 | N.A. | 16 000 | 10 000 | 27 000 |
| Companies Included | 120 | 400 | 7 500 | 3 500 | 11 000 |
| Company List | |||||
| Facility List | |||||
| Total GHG Emissions per year (million tCO2e) | 28 | 340 | 1 700 | 3 000 | 5 000 |
| Total free carbon allowances per year (million tCO2e) | 19 | N.A. | 750 | N.A. | 750 |
| Historical time scope 2005 – 2020 | 2005 – 2020 | 2014 – 2018 | 2005-2020 | USA : 2010-2018 / Canada : 2004 – 2018 | 2004 – 2018 (variable by zone) |
| Search Interface | |||||
| Sector Selection (by zone) | |||||
| Automatic Ranking | |||||
| Sign Up Free | Select | Select | Select | Select |


There are several options to access the content of our data platform :
To discuss your data needs and the available options, please contact us at info@dev.carbondata.world .

© 2022-2024 Corporate Carbon Data | All rights reserved | Copyright Notice | Terms and Conditions | Privacy-Policy | Return Refund Policy